
The PLC continues running. Motors respond to the automatic sequence, sensors change state and the machine completes production cycles.
Yet the HMI shows the same conveyor speed for several minutes. The operator sees 38.0 m/min, although the speed in the controller's recorded data has changed.
The first suspicion is often that the PLC has frozen. Another technician suspects a broken Ethernet cable or a malfunctioning touchscreen.
But an industrial visualization system contains several separate layers: the actual process, PLC variables, communication driver, tag processing, server, HMI client, historian and displayed graphic. A failure or delay in one layer does not necessarily stop the others.
The engineering challenge is to determine whether the process value is genuinely unchanged, the controller has stopped updating it, the communication system has lost the value, or the display is showing information that is no longer current.
1. A visible number is not proof of a current measurement
A numeric HMI field may contain a value that was previously received successfully. Depending on the platform and application configuration, it may continue to display that value after communication fails.
For example, Siemens WinCC Unified distinguishes a bad-quality condition where communication is unavailable but a last usable value remains. It also distinguishes cases where no usable value is available and uncertain-quality conditions where a value is retained.
Therefore, a perfectly plausible displayed number can be misleading when its quality or age is not visible.
A useful process indication should make it possible to establish:
- Value: What numerical or logical information is being displayed?
- Quality: Is the information considered valid, uncertain or invalid by its data source?
- Timestamp: When was the information observed or updated?
- Source: Which PLC, device, expression or historian provided it?
- Context: Is the screen showing live, cached, substituted or historical information?
A number without this context can be a poor basis for interpreting a production fault.
2. Separate the process, PLC, SCADA server and HMI client
A simplified architecture may look like this:
Physical process → PLC input or internal variable → communication connection → SCADA tag → HMI visualization
A historian, alarm service and other applications may subscribe to or store information alongside the visualization.
These layers can fail independently.
| Layer | What it contributes | What can appear wrong |
|---|---|---|
| Physical process | Actual position, pressure, speed or temperature | The measurement may genuinely be stable or different |
| PLC program and I/O | Acquires and interprets process information | Variable may not be updated as expected |
| Communication driver | Transfers data between systems | Connection loss, rejected address or driver issue |
| SCADA tag service | Resolves, evaluates and distributes values | Bad quality, stale data, incorrect tag reference |
| HMI client | Renders the value for the operator | Frozen display, inactive screen binding or outdated client state |
| Historian | Stores selected values and timestamps | Missing or compressed samples, delayed writes or historical context |
A running PLC does not establish that the HMI client has received its latest data. Conversely, a display that fails to update does not establish that the PLC has stopped.
3. Good, uncertain and bad tag quality are not interchangeable
Many SCADA and industrial data systems associate a quality status with tag values.
The exact status names and encodings depend on the implementation. Siemens WinCC Unified and Inductive Automation Ignition both document mechanisms for distinguishing valid and invalid or degraded-quality values.
| General quality class | Typical meaning | Diagnostic caution |
|---|---|---|
| Good | The provider considers the value usable | Additional freshness and application context can still matter |
| Uncertain | The value may have a limitation or special status | It should not automatically be treated as fully current and reliable |
| Bad | The value is not considered valid for normal use | A remembered numerical value may still appear on screen |
| Stale or last known | No sufficiently current evaluation or update is available | The displayed number may reflect an earlier state |
| Substitute or manual value | An alternative value was intentionally supplied | It must not be mistaken for an unmodified process measurement |
These labels are conceptual. When diagnosing a specific installation, use the actual quality code and the manufacturer's documentation instead of interpreting colors or status names generically.
4. Siemens explicitly distinguishes different communication failures
WinCC Unified quality documentation separates several situations that can otherwise look identical from the operator's viewpoint.
Examples include:
- No communication, with last usable value: Communication to the source has failed, but an earlier value exists.
- No communication, no usable value: The source is unavailable and a valid previous value is not available.
- Not connected: The consumer-side connection has been disconnected.
- Configuration error: The value cannot be used because the configuration is inconsistent.
- Uncertain, last usable value: The connection exists, but the source has stopped providing updates.
- Substitute value: A configured alternative is used instead of the unavailable source value.
These distinctions matter because the first technical question is not always "Is Ethernet working?" It may instead be "Which quality condition is being reported and where does it originate?"
A local visualization can remain responsive while its underlying process data is invalid.
5. The timestamp is as important as the displayed value
A value represents the process at a particular moment, even if the screen shows it later.
For a reconstructed example:
| Item | Illustrative reading |
|---|---|
| Displayed conveyor speed | 38.0 m/min |
| Data value timestamp | 10:14:02 |
| HMI client clock | 10:17:45 |
| PLC's independently recorded speed | 24.5 m/min at 10:17:40 |
| Tag quality | Bad — last usable value |
The displayed speed is plausible and was once valid. It is not evidence of the current conveyor speed.
The meaningful discrepancy is between the age of the HMI value and the independent process history.
Clocks may not be synchronized across PLCs, servers, HMIs and historians. Time-zone settings, clock offsets and timestamp semantics must therefore be considered before making precise chronological conclusions.
6. Source timestamp and server timestamp can represent different events
Industrial communication systems, particularly OPC-based ones, may distinguish the time associated with the original source data from a timestamp assigned by a server when the value is processed or observed.
This is useful because an HMI client can receive a recently transmitted message that contains an old process value.
For example, a communication gateway might report its latest cached data successfully even though an upstream instrument has stopped updating. The network transmission occurred recently, but the underlying measurement may be older.
A trustworthy investigation identifies which timestamp the application displays and what event it actually represents.
Inductive Automation's historian documentation also distinguishes recorded timing and the timestamp source used for stored values. These choices can affect how historic trends are interpreted.
7. Why polling and subscription settings matter
Some visualization systems periodically request values from a device. Others receive updates through a subscription-based communication arrangement or a managed tag group.
The effective update rate can depend on several factors:
- PLC or device update behavior.
- Driver polling or requested sampling interval.
- Tag-group evaluation or subscription settings.
- Server resource availability.
- HMI client subscriptions and display update policy.
- Network performance and implementation-specific constraints.
A display refresh interval of 250 milliseconds does not guarantee that a process measurement changes or is acquired every 250 milliseconds.
Important distinction: The rate at which a screen is redrawn, the rate at which the server evaluates a tag and the rate at which a source produces new information are different concepts.
8. A truly constant process value can resemble a frozen tag
A constant number is not necessarily stale.
A conveyor may remain at a fixed commanded speed during a steady operating state. A tank temperature may remain nearly constant because the process is controlled effectively. A sensor may legitimately report an unchanged status for a long period.
To distinguish normal stability from missing updates, engineering evidence can include:
- An independent, relevant process variable expected to change.
- Tag quality and last evaluation or source update information.
- Communication and subscription diagnostics.
- A documented process event that should affect the measurement.
- Source-side records showing whether the PLC value actually changed.
A diagnostic conclusion requires evidence of an expected change, not simply a long period without visible movement on the screen.
9. A correct PLC value can be connected to the wrong HMI tag
An HMI screen may show an unexpected value because its tag path or data binding refers to a different address, variable or data source.
This can occur after controller changes, tag renaming, project migration, driver configuration updates or reuse of a screen from a different machine.
The connection itself can be healthy. A quality status may even report that the requested tag is accessible while the wrong variable is being displayed.
Possible indications include:
| Observed behavior | Interpretation worth considering |
|---|---|
| One value is plausible but never follows the expected process | Incorrect binding or wrong variable source |
| Several values become unavailable after a software change | Common driver, namespace or project configuration issue |
| One field is blank while other fields update | Individual tag or binding issue |
| Value updates correctly in one screen but not another | Client-level binding, display or cached context difference |
| The data appears scaled incorrectly | Tag data type, engineering units or conversion logic |
A tag's configured path and meaning are just as important as whether it can be read.
10. A derived or calculated tag adds another diagnostic layer
Not every value displayed by an HMI is read directly from one PLC memory location.
A SCADA system may calculate a derived value, perform scaling, select among data sources, apply an expression, or expose a value from a database query.
If a source tag becomes invalid, the derived tag may also report degraded quality, depending on the implementation.
In Ignition, tag diagnostics can reveal source dependencies and errors. The documentation also describes how a derived or referenced tag may inherit problematic quality from its inputs.
An engineer should therefore distinguish a problem with raw PLC data from a problem with the calculation or binding that uses that data.
11. Driver and network health are related but different
A network switch may report an active Ethernet link while an HMI communication driver reports a failed session or an invalid tag.
Similarly, a ping response proves only a limited aspect of IP reachability. It does not demonstrate that the expected industrial read requests, subscriptions or application messages are working.
Useful diagnostic categories include:
| Observed scope | Potential diagnostic direction |
|---|---|
| All HMI values from one PLC disappear | Shared communication session or source condition |
| Values from many controllers disappear together | Common server, network or infrastructure condition |
| One tag is unavailable, but others from the same device work | Tag path, permission, data type or individual evaluation |
| Operator HMI is frozen, but server-side data remains current | Client display or client-server path |
| HMI is current, but historian stops recording | History configuration, storage or persistence problem |
The scope of the problem can be more informative than a single network connectivity test.
For network diagnostics, see Industrial Ethernet Diagnostics: What CRC Errors, Link Flaps and Packet Drops Really Mean.
12. Historian gaps do not always mean the PLC stopped sending data
A historical trend is not necessarily a complete record of every process change.
Historians may use a deadband, compression, sampling rules or change-based logging. With change-based storage, a long period of a constant process value may generate few or no new samples.
Inductive Automation's Ignition 8.3 documentation explains how tag history uses timestamp, quality and original value metadata and how its deadband and sampling configuration affects storage.
A missing point on the trend could therefore result from storage policy rather than communication failure. Conversely, a line drawn between historical points may create an impression of continuity that was not directly measured at every instant.
Diagnostic principle: A historian graph is an interpretation of stored samples, not automatic proof of uninterrupted real-time acquisition.
13. Alarm events require their own time and quality context
A value may cross a configured threshold while a communication problem or delayed update affects the operator display.
The exact behavior depends on where the alarm is evaluated: in the PLC, the SCADA tag service, an HMI client or another component.
Acknowledge, active, cleared and historical event states also have different meanings. An acknowledged alarm is not necessarily cleared, and a cleared alarm does not mean the cause was corrected.
When reviewing a disputed alarm event, the engineering team should establish:
- Which system evaluated the alarm condition.
- Which value and quality state that system used.
- Whether the alarm relied on current, cached, substitute or historical data.
- Which timestamp represents activation, logging or acknowledgement.
- Whether the required event path remained available during the incident.
An HMI that shows a normal-looking number must not be used to dismiss an alarm without understanding data freshness and source quality.
14. Reconstructed case: the conveyor speed that remained at 38.0
Consider a reconstructed packaging line with an operator HMI, a PLC and a central SCADA service.
During a production run, the conveyor's recorded actual speed changes from 38.0 to 24.5 m/min as the normal machine sequence changes. The PLC remains in RUN and the equipment continues operating.
The HMI still displays 38.0 m/min. Its screen remains interactive, other values update and the operator can navigate normally.
The initial hypothesis is a failed speed sensor.
However, the PLC's own event data shows the relevant speed value changing as expected. The SCADA tag diagnostic record reports bad quality with the last usable value for the display's data source during the same period.
That difference narrows the fault domain. The problem is no longer simply "speed sensor not responding." It concerns the path between the controller's current value and the HMI tag/display.
This is a reconstructed educational case, not a documented factory incident.
15. A representative event timeline
The following times and readings are illustrative.
| Time | PLC/process observation | SCADA/HMI observation |
|---|---|---|
| 10:14:02 | Speed 38.0 m/min | Speed 38.0; quality good |
| 10:14:05 | Machine continues normal cycle | Communication driver reports disrupted data acquisition |
| 10:14:07 | Speed begins to change | Last displayed speed remains 38.0 |
| 10:14:12 | Speed 24.5 m/min | Speed 38.0; quality bad/last usable |
| 10:17:45 | PLC remains in RUN | HMI still displays 38.0; screen navigation works |
| After service recovery | Current speed is available | Tag returns to good quality and current updates |
This timeline distinguishes process activity, communication status and what the operator actually saw.
The root cause cannot be assigned to a cable or server solely from this table. More specific driver and infrastructure evidence would be needed.
16. A second case: healthy SCADA values but an outdated HMI page
A different reconstructed installation has two operator screens and a central server.
One screen displays current process values. The other retains old values after being left open for an extended period. Server-side tag diagnostics remain good and show recent timestamps.
That pattern suggests a possible client-level display, subscription or application-state issue rather than a common loss of communication with the PLC.
The investigation should distinguish the server's current tag state from the state of a particular rendered screen.
Lesson: When only one client is affected, a common upstream PLC failure becomes less likely, although evidence is still required before concluding that the HMI client itself is defective.
17. Why a communication-recovery event needs verification
The disappearance of a bad-quality indication is encouraging, but the recovery is not fully understood until the value's source, timestamp and expected behavior are verified through approved methods.
For example, the client may reconnect to a server without the upstream source having resumed its normal updates. A last-known or substitute value may still be available.
An engineering acceptance record should therefore identify the relevant quality status, source data freshness and the process condition to which the value relates.
A successful screen refresh by itself is weaker evidence than a verified return to the intended data path.
18. An evidence matrix for HMI and SCADA faults
| Evidence | What it supports | What it cannot prove alone |
|---|---|---|
| PLC reports RUN | Controller is executing in that mode | Every PLC variable or HMI link is current |
| HMI screen responds to touch | Client interface is functioning | Displayed process data is valid |
| Tag quality bad | Data service reports invalid information | Exact network or hardware component responsible |
| Last-known timestamp is old | Displayed value may be stale | Physical process is unchanged |
| Historian line is flat | Stored representation has little variation | Every real-time sample was received |
| Network link indicator is active | Physical Ethernet link exists | Application communication is healthy |
| Another HMI shows current values | Common PLC source may be available | Which part of the affected client's path failed |
| Alarm was acknowledged | Operator or system acknowledged the event | Alarm cause has been removed |
This matrix helps avoid mistaking one healthy component for proof that the entire visualization chain is correct.
19. A useful diagnostic report should capture four dimensions
A well-structured report for an HMI/SCADA discrepancy contains:
- Process context: What the machine was doing and which physical variable was relevant.
- Control context: Which PLC or device owned the source value and what its accepted records showed.
- Data context: Tag path, value, quality, relevant timestamp and communication or calculation status.
- Presentation context: Which HMI client or historical screen displayed the value and how it differed from the source.
Additional fields may include the application version, operating mode, recent project changes, server/client event records and known clock offsets.
Documentation should state which observations are direct and which conclusions are inferred.
20. Common mistakes in HMI and SCADA troubleshooting
- "The screen is responsive, so its values are live." Interface navigation and process-data acquisition are separate.
- "The PLC is in RUN, therefore the HMI is correct." RUN mode does not establish data freshness.
- "A frozen number proves the sensor failed." The data path or display binding may have stopped updating.
- "Bad-quality data are the same as zero." Invalid, stale and substitute states have distinct meanings.
- "A current server timestamp proves a current physical measurement." Source and server timestamps can represent different events.
- "The trend has no new point, so communication is broken." Deadband and logging policies may explain sparse history.
- "The ping is successful, so all tag communication is healthy." IP reachability is not application-level proof.
- "Acknowledged alarm means the process is back to normal." Alarm acknowledgement is not necessarily a process-state change.
- "Increasing refresh rate always fixes frozen values." It cannot restore an unavailable source or incorrect binding.
- "Replacing the HMI is the first solution." Evidence may instead point to driver, tag mapping, server or upstream communication.
Technical conclusion
An HMI may display a convincing but outdated value even while the PLC continues to run normally.
The correct diagnosis requires more than looking at the displayed number. It requires understanding where the value originated, when it was last updated, which quality state it carries, how the tag is configured and where the data stopped progressing toward the screen.
A reliable visualization design makes stale or bad data distinguishable from valid current measurements. A reliable investigation compares the controller's records, SCADA tag diagnostics, timestamps, network evidence and client behavior.
Only then can a "frozen HMI" complaint be translated into a specific and supportable engineering explanation.
For related topics, read Why Does a PLC Sequence Get Stuck on One Step?, Industrial Ethernet Diagnostics and Analog Signals & Troubleshooting.
Authoritative references
- Siemens — WinCC Unified: Quality Codes of HMI Tags: bad/uncertain/good quality states, last usable values, connection and configuration conditions.
- Inductive Automation — Ignition 8.3 Tag Diagnostics: available diagnostic information about tag value, quality, timestamps, errors and data-source status.
- Inductive Automation — Ignition 8.3 Configuring Tag History: stored timestamps and quality, sampling behavior, deadband and historian interpretation.
- Inductive Automation — Ignition 8.3 Tag Properties: tag evaluation and value-source configuration.
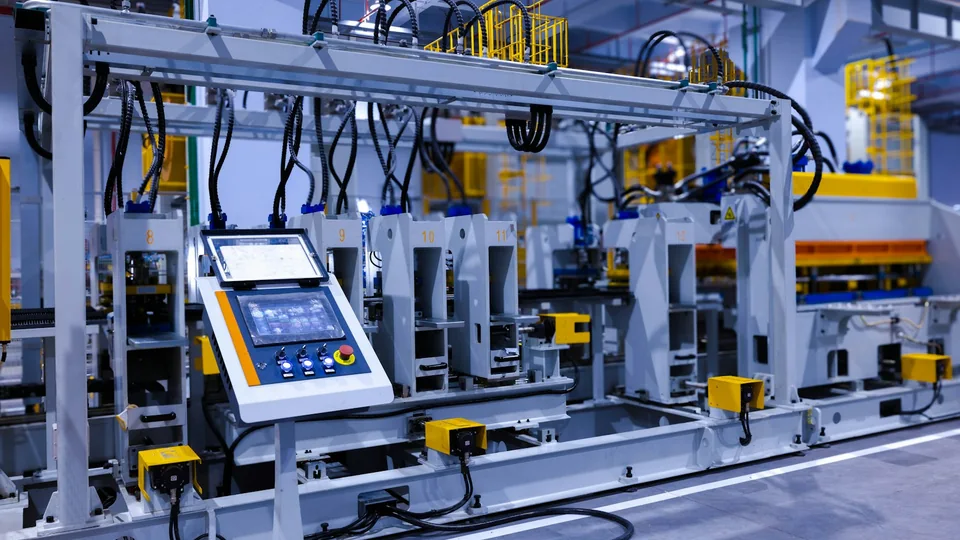
Cover photograph: touchscreen control panel on industrial manufacturing machinery by Homa Appliances, published on Unsplash under the Unsplash License. The photograph was cropped, resized to 960 × 540 pixels and converted to WebP for the article. It illustrates an HMI in a manufacturing environment, not the reconstructed diagnostic examples.

